
Node.js debugging is an essential tool for crafting robust and error-free server-side applications. Whether you’re a seasoned Node.js developer or just starting out, mastering debugging techniques is crucial for maintaining the integrity of your code. In this comprehensive four-part blog series, we’ll delve into the intricacies of Node.js debugging using WebStorm, the powerful IDE that empowers developers to build and debug Node.js applications. Embark on this journey and discover how to identify and rectify errors effectively, ensuring that your Node.js applications run seamlessly
JetBrains WebStorm is a powerful integrated development environment (IDE) for JavaScript and its related technologies, such as TypeScript, React, Vue, Angular, Node.js, HTML, and CSS. It offers a comprehensive set of features that help developers write code faster and more efficiently, including code completion, syntax highlighting, error detection, refactoring, and debugging.
WebStorm is also highly customizable, allowing developers to tailor the IDE to their specific needs and preferences. It also supports a wide range of plugins that can further extend its functionality. If you are a JavaScript developer, WebStorm is an essential tool that can help you take your productivity to the next level.
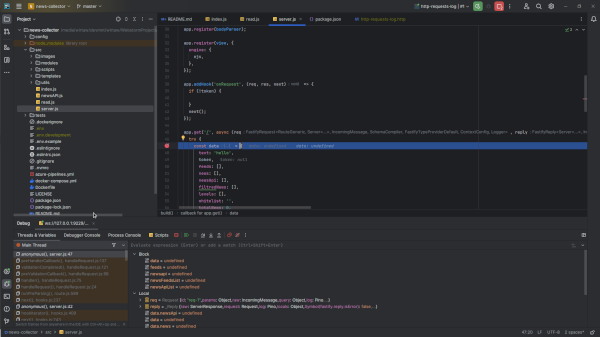
Run your application with an --inspect or --inspect-brk flag, and set breakpoints in the code where necessary. You can then create a Node.js run/debug configuration and start the debugger from the built-in Terminal or the Run or Debug tool window. You can also debug an already running application with the Chrome Debugging Protocol or the V8 Debugging Protocol.
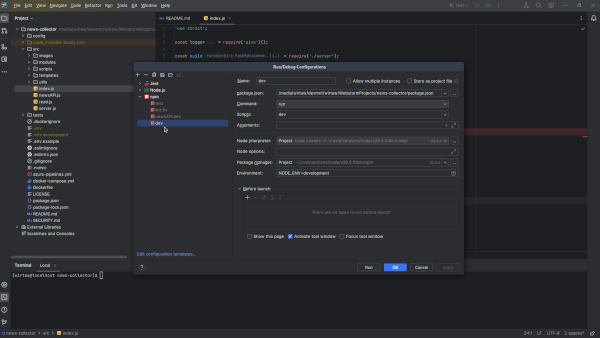
Create a Node.js run/debug configuration
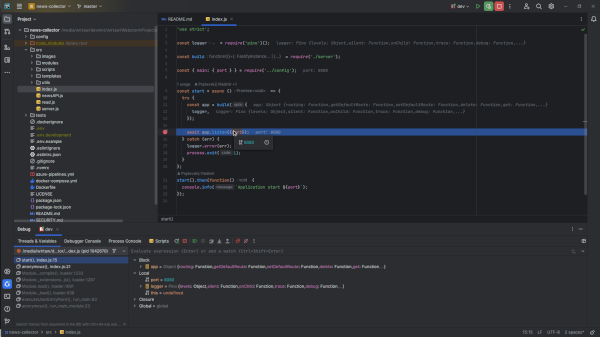
Run or Debug tool window
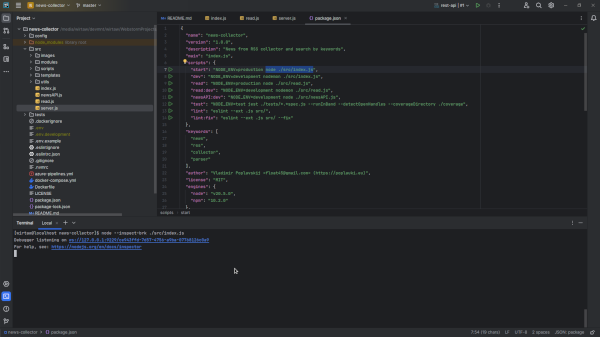
Running an application with the Chrome Debugging Protocol
Leave a Reply